Summary:
- Run Plate 4
- Discuss results from Plate 1, 2, 3
- Plan presentation on Friday
Methods:
Due to rather unsatisfying results from plates 1, 2, 3 our group decided to make another plate. Plate 4 was loaded with Elongation Factor and a new primer HSP70B. Since we had room left in the PCR plate, we decided to run Control cDNA along with Superoxide dismutase to make sure we have conclusive results this primer. This time we made sure to get new PCR water because we hypothesize it may have been an issue in earlier experiments.
HSP70-B
- Column 1 Control
- Column 2 Heat
- Column 3 Mechanical
- Column 4 M-->H
- Column 5 C. Virginica
- Column 6 NTC
- Column 7 Control
- Column 8 NTC
Results/Conclusion:
Plate 4 contained cDNA from C. gigas from all 5 treatment groups and cDNA from C. virginica with HSP70B primer. It had amplification for control and mechanically stressed treatment groups with cDNA of the C. gigas. Figure below shows relative arbitrary expression of HSP70B relative to Elongation Factor. Wells with control cDNA and Superoxide Dismutase did not have any amplification again.
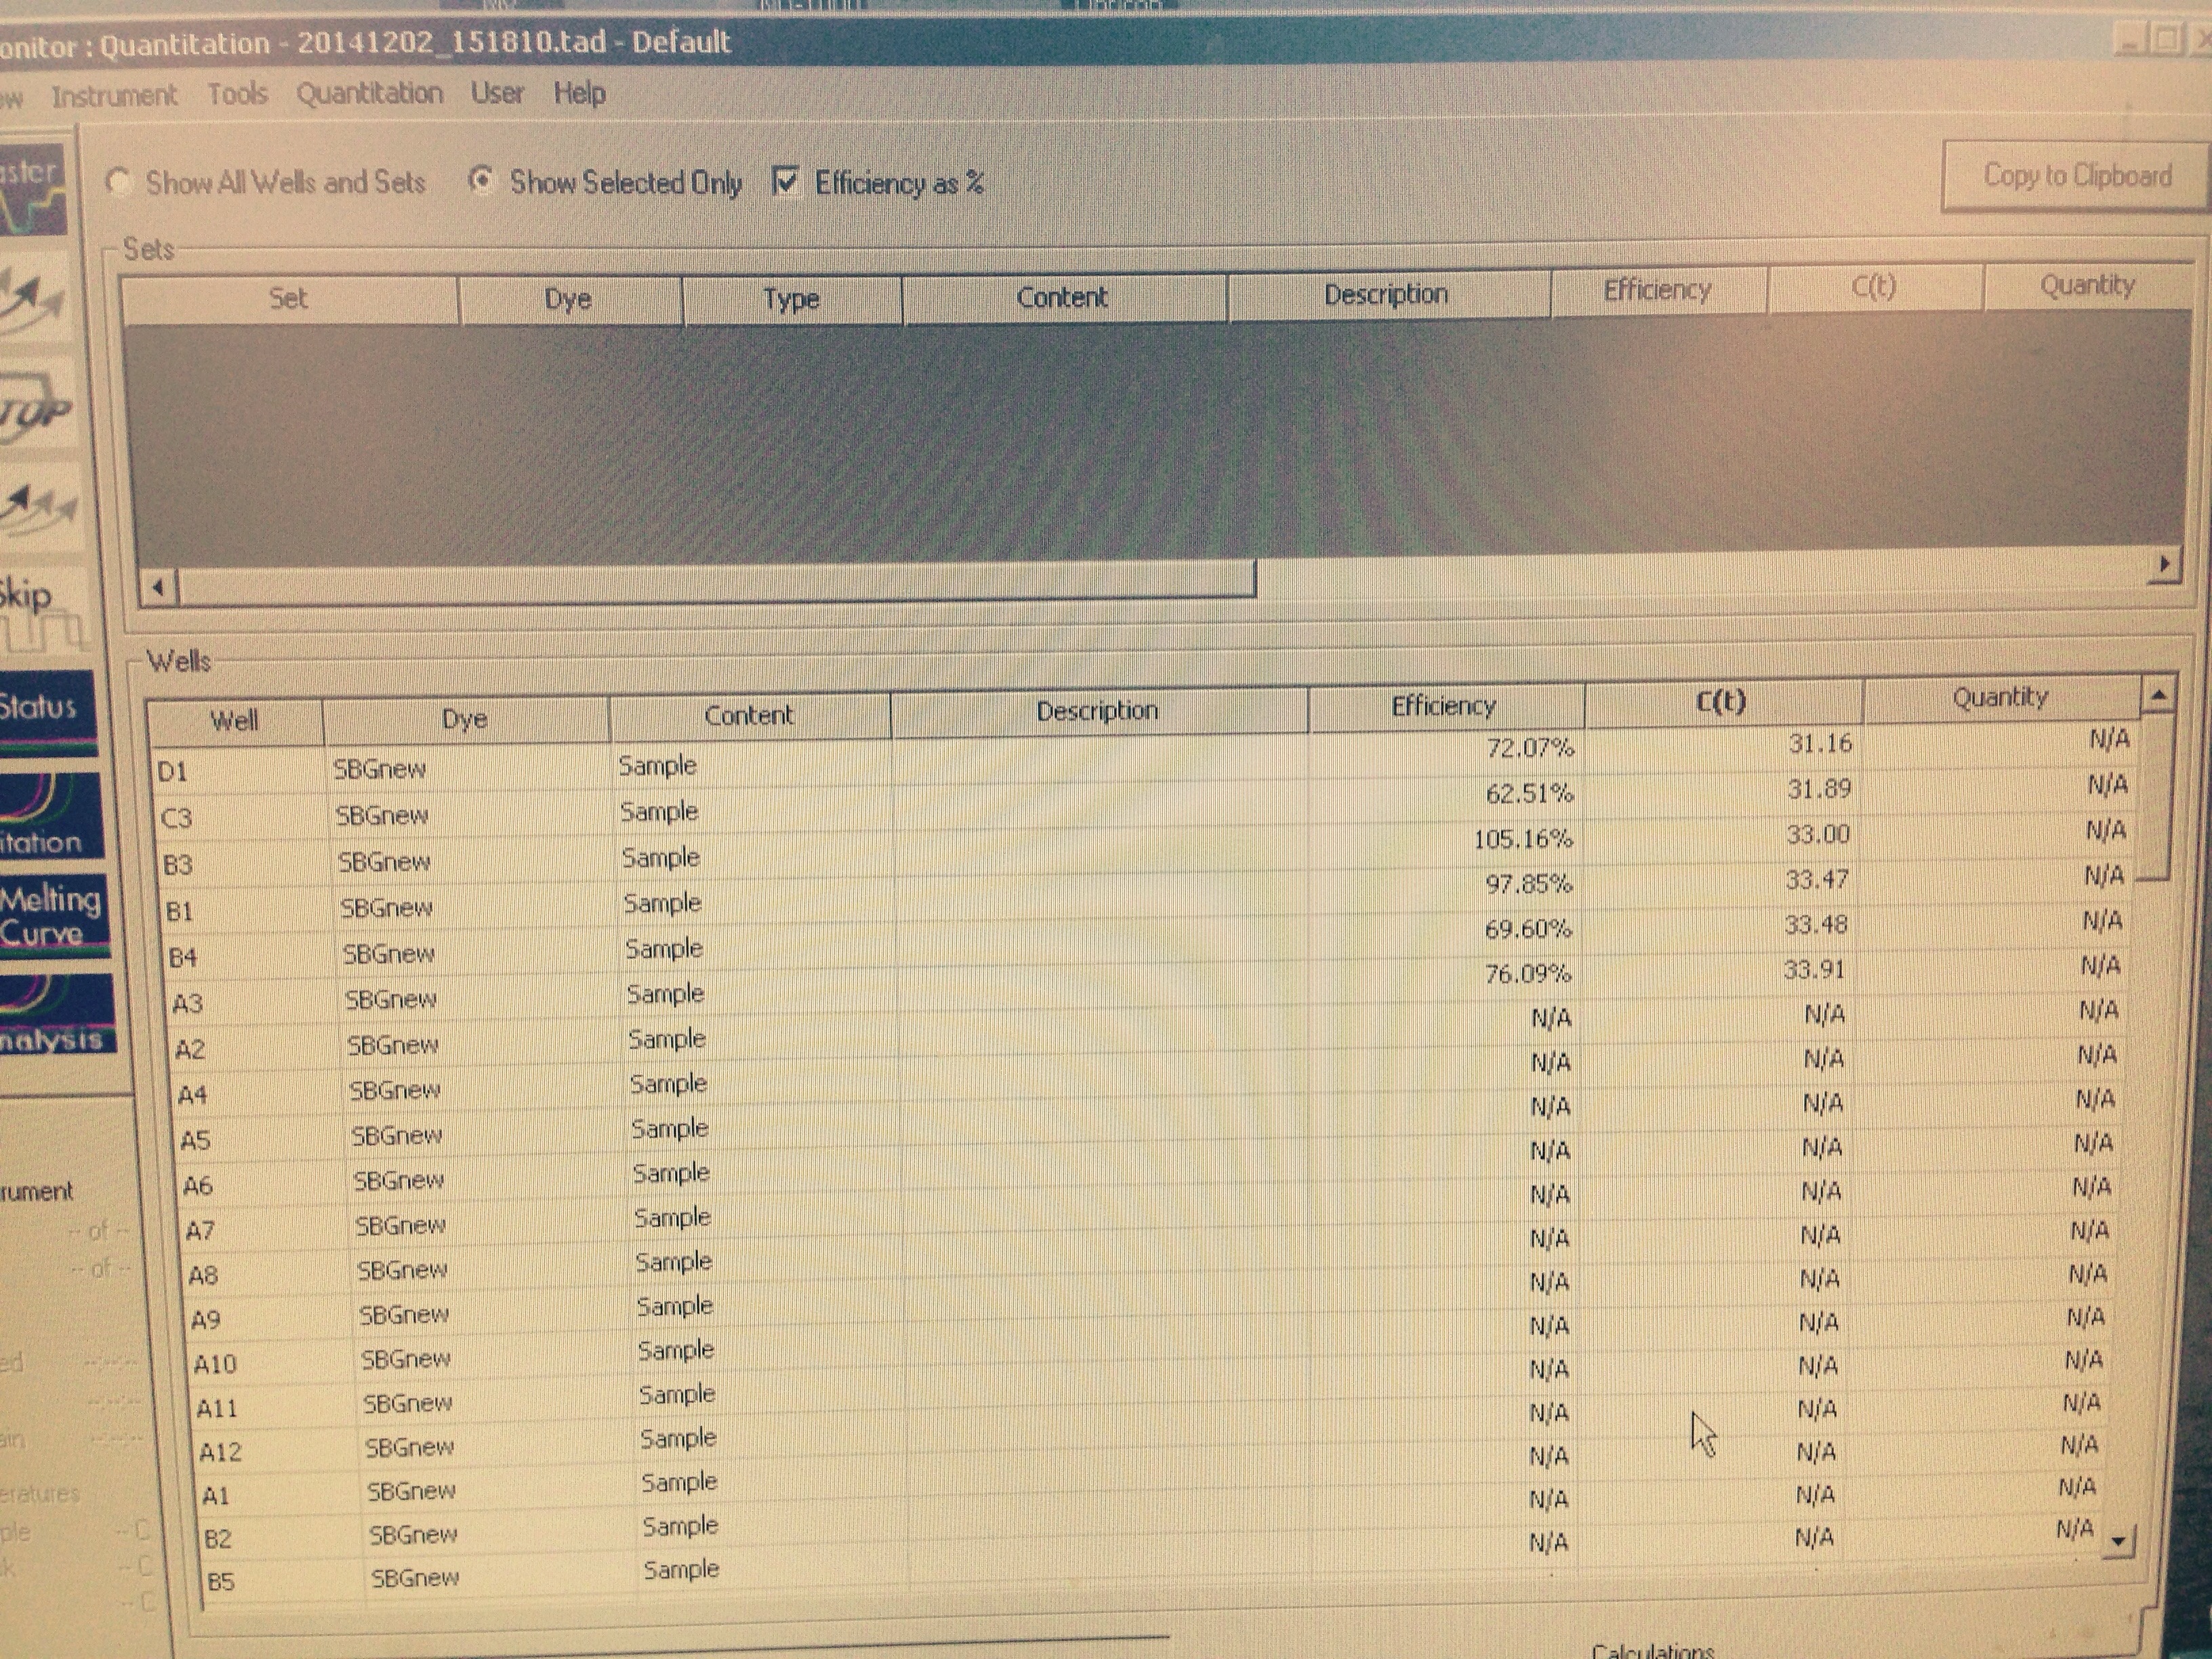
Reflection: There must be something wrong with a combination of Superoxide Dismutase and Control cDNA since after two trials it didn't get any amplification therefore we do not have conclusive results from Plate 1 (even though arbitrary expression was high) we don't know what it would have been in the control treatment.
November 25, 2014 Lab 8
Summary:
Reverse transcriptase was used to get cDNA which was later used for quantification in qPCR.
Materials and Methods:
Nov. 24, 2014
1. RNA was reverse transcribed using the nanodrop spectrophotometer according to the protocol followed in Lab 3.
Nov. 25, 2014
2. cDNA obtained from the day before was prepared for qPCR along with the following primers: HiF-1a, HSP-70B, Metallothionein, Cytochrome P-450, Glutathione s transferases, and an elongation factor.
Results and Conclusions:
Plate 1 which contained cDNA with Elongation Factor and cDNA with Superoxide Dismutase
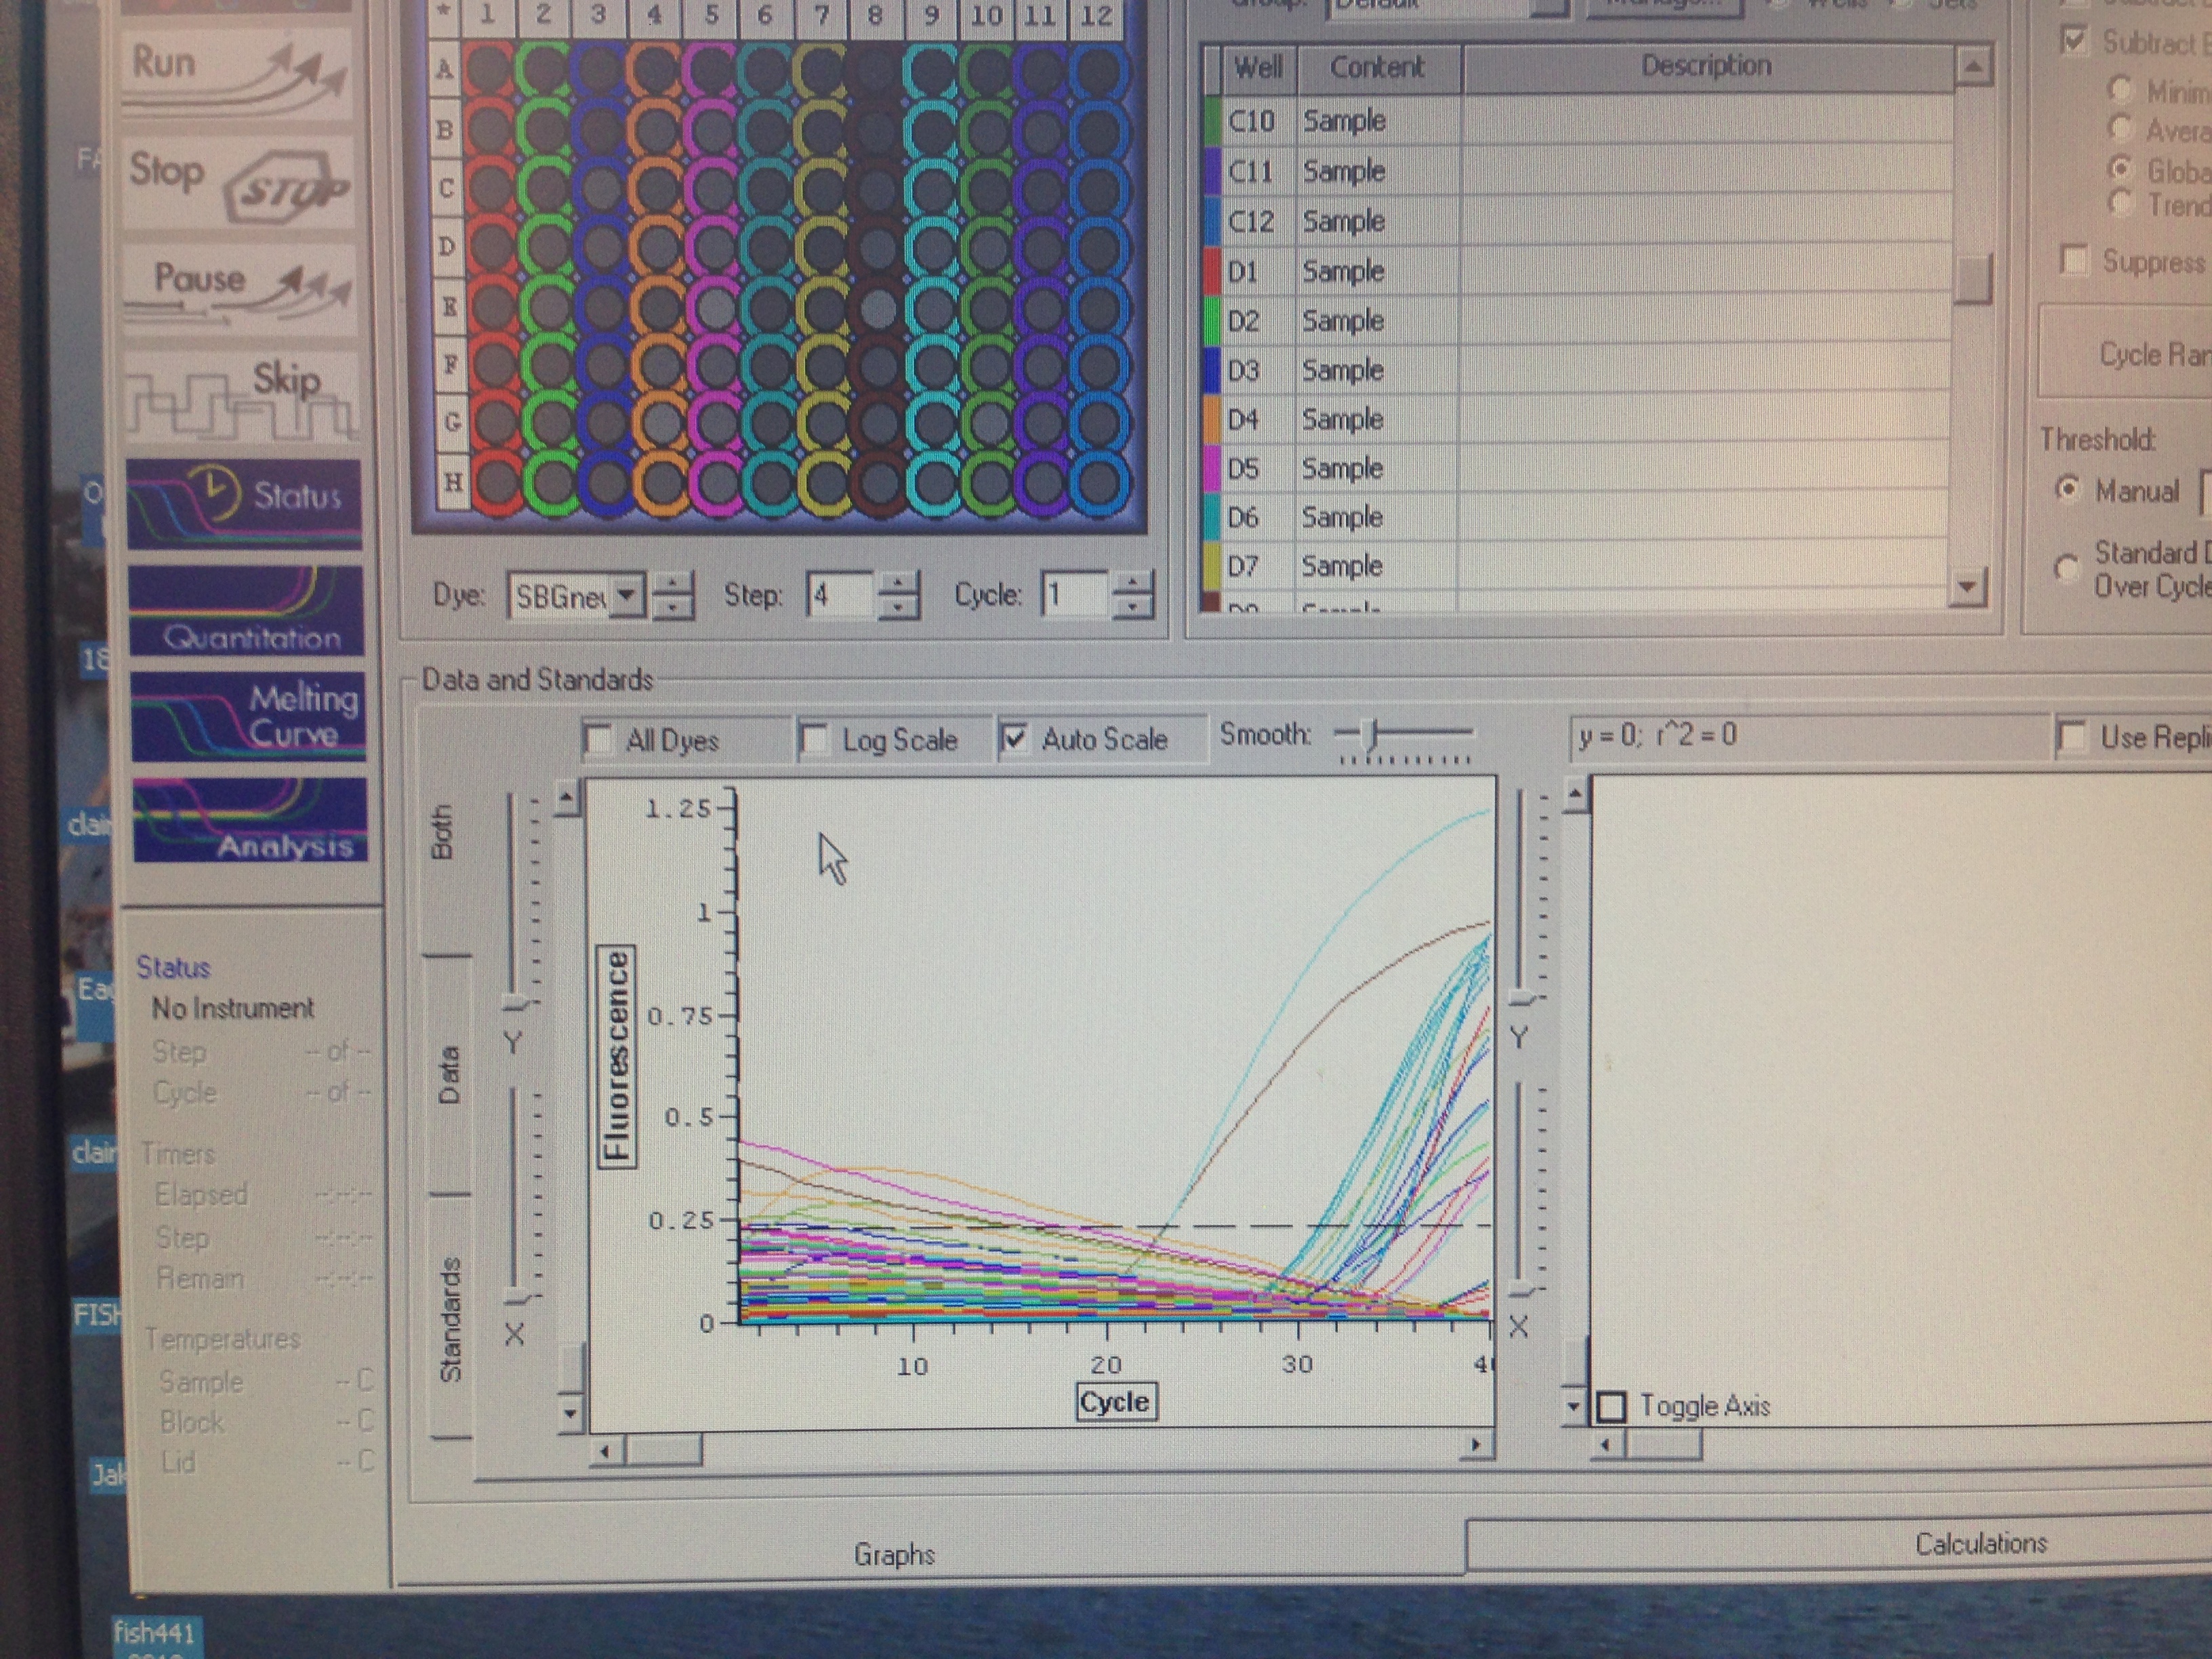
Most wells on this plate had a somewhat normal amplification with a few exceptions. General pattern seems to be good amplification observed in wells D and C throughout columns 1-12. Amplification curves are clustered tightly together (except well D8 and D9) which indicates minimal variation among treatment groups
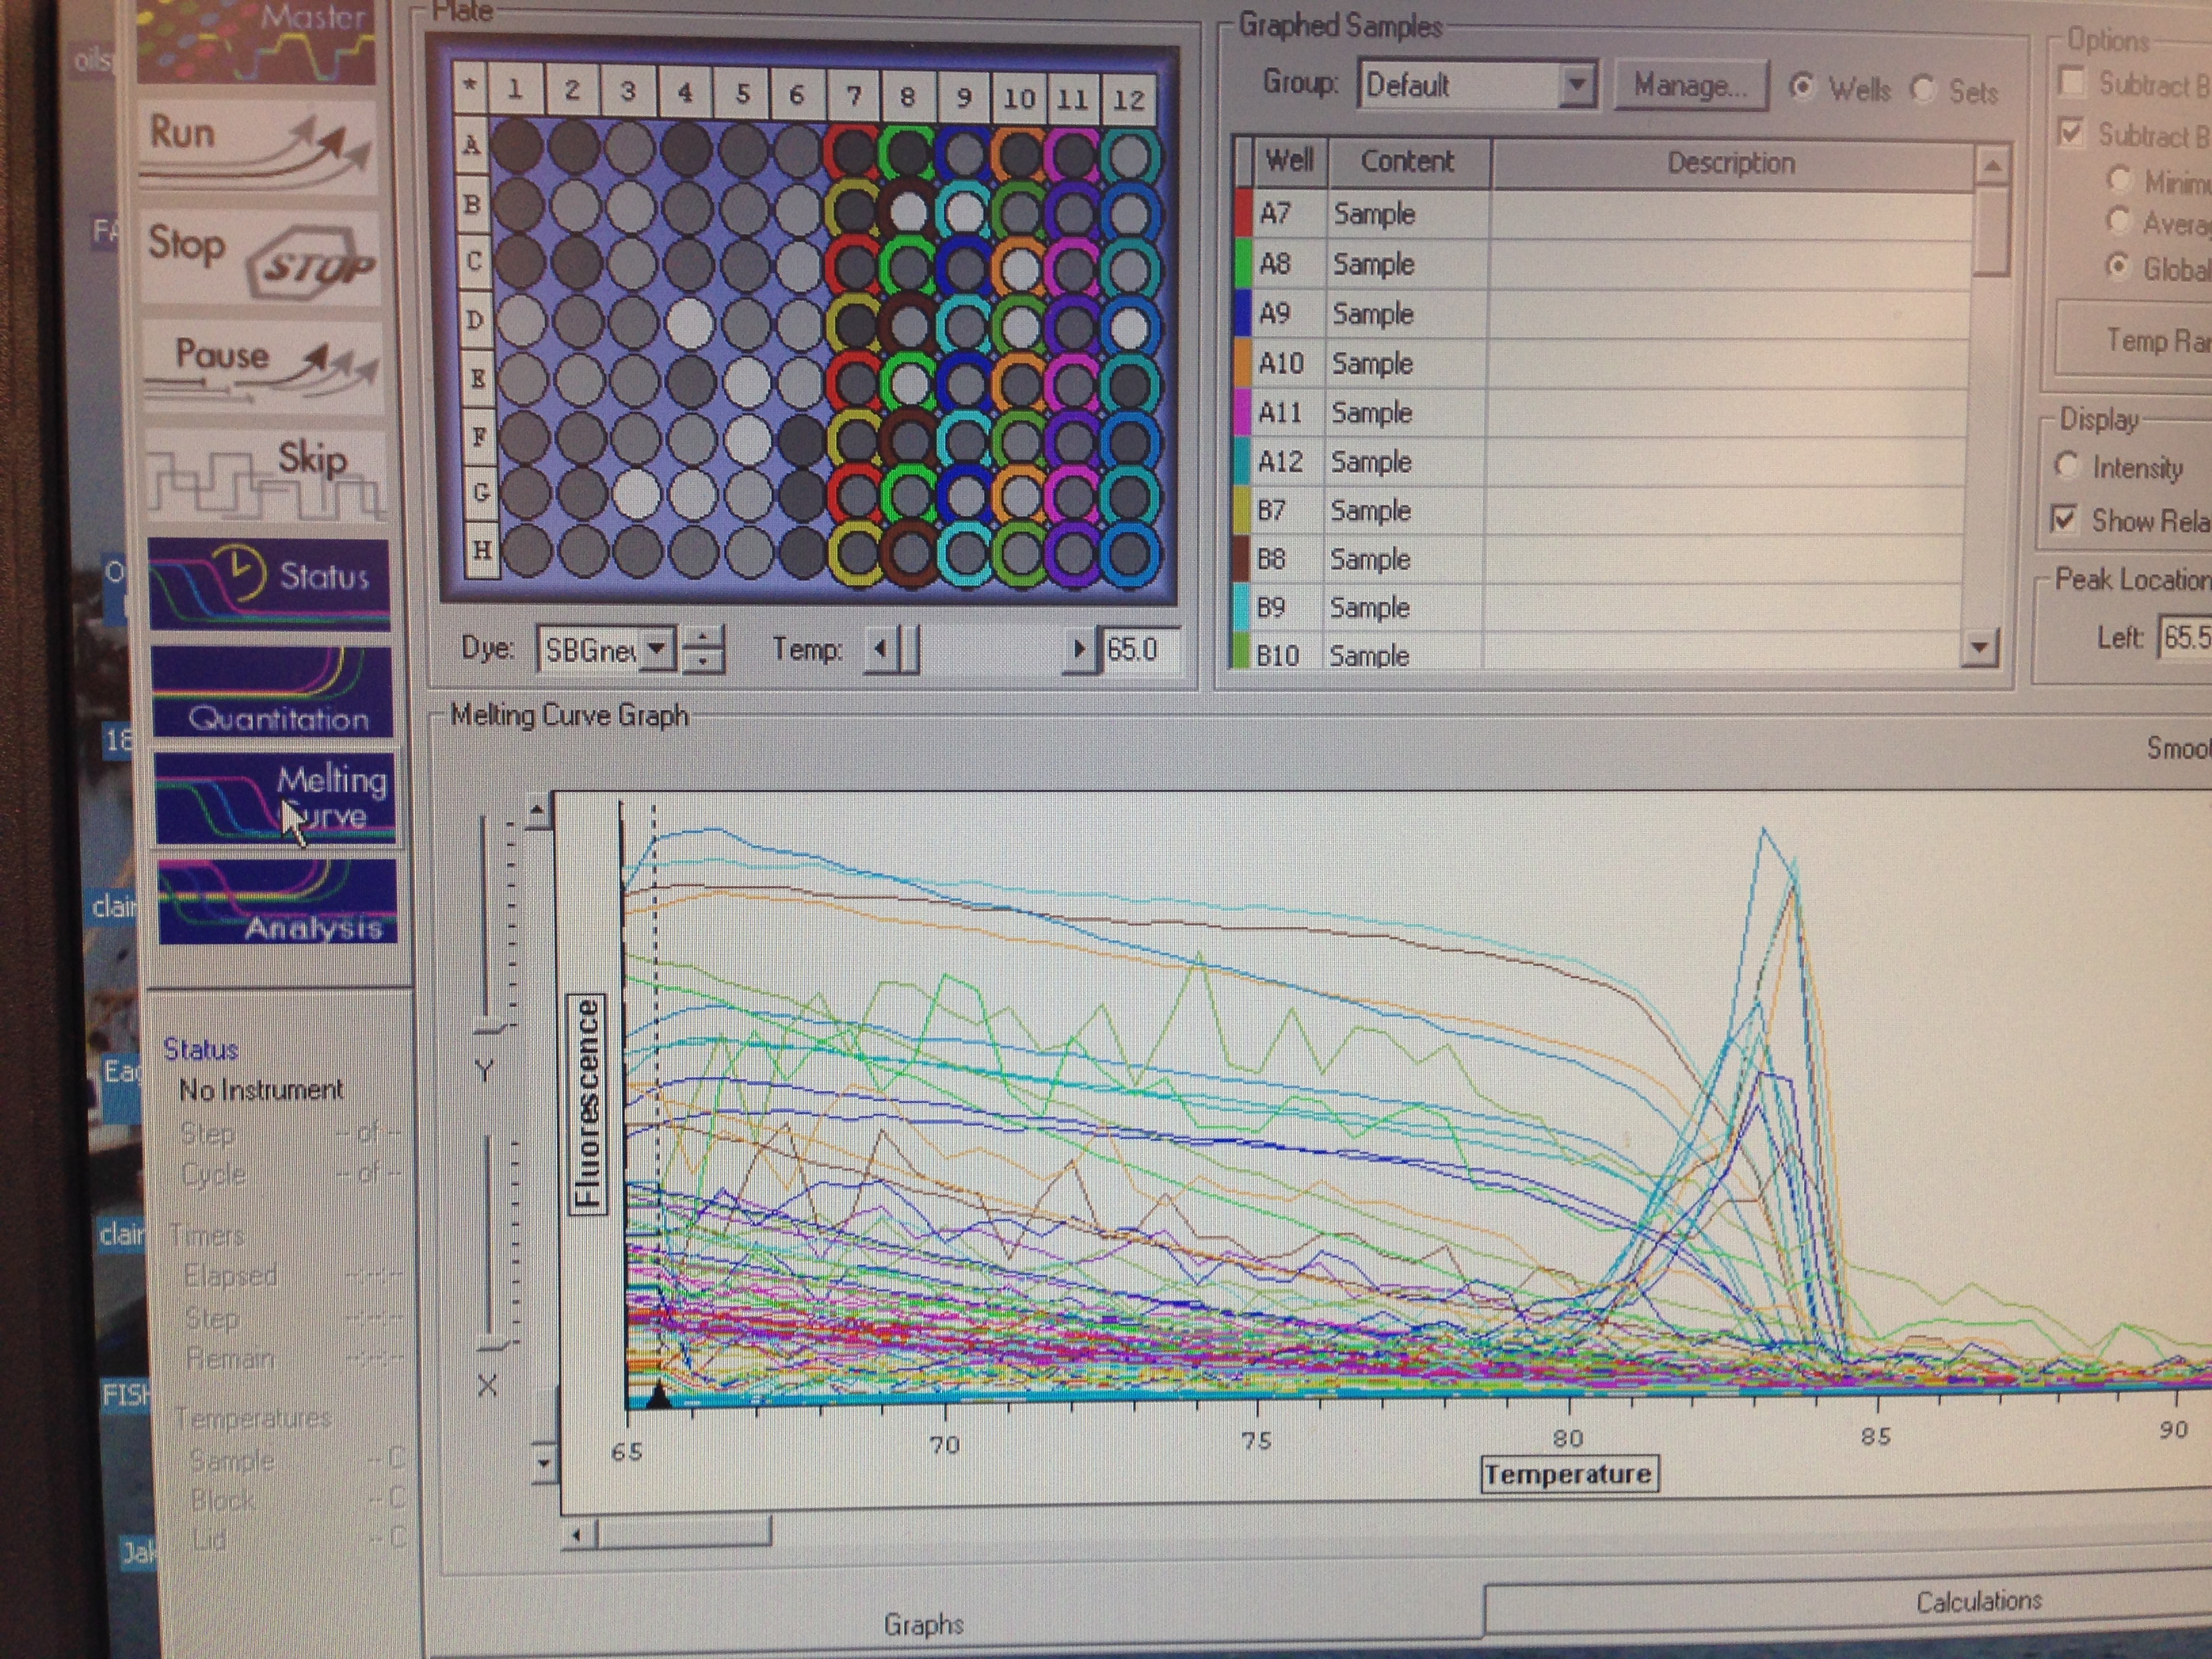
Melting curve of cDNA samples with Superoxide Dismutase. Melting curve is abnormal since it has a slightly negative slope. Superoxide Dismutase primer seems to bind to cDNA from wells A or B to produce a PCR product shown by a curve with a single peak. Wells A8 and B10 have multiple peaks which indicates nonspecific amplification.
Plate 2 which contained Elongation Factor and HiF 1alpha
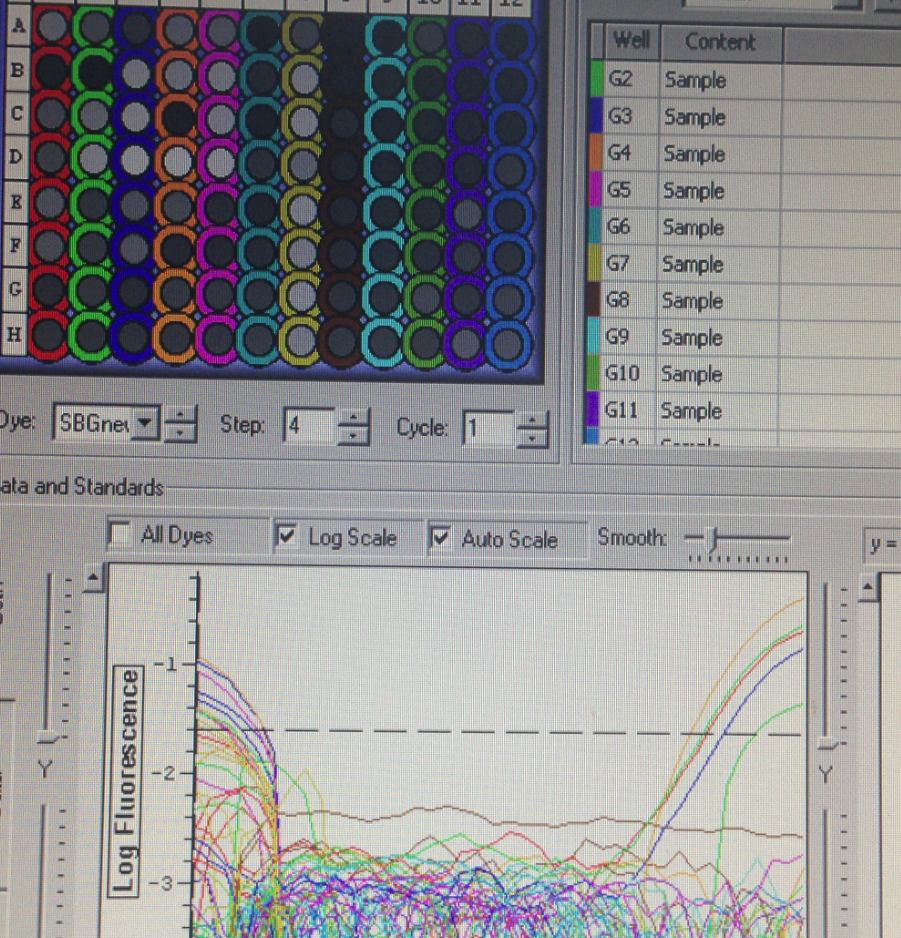
Plate 3 which contained metallothionein, cytochrome p-450, and glutathione s-transferases did not have any amplificati
There are a number of reasons for getting no amplification in qPCR. Most common reasons are due to problems with reverse transcriptase and/or integrity of the RNA sample. It is very likely the RNA sample was of poor quality due to RNA degradation. To prevent this problem in the future, it is important to store samples properly prior to RNA isolation, to disrupt samples completely to yield maximum RNA out of the sample and to maintain the experiment free of contamination. Another way RNA sample could be the problem is due to a lack of the template sequence. Genes that we were testing for (Metallothionein, Cytochrome P450, Glutathione s-transferases) may not be expressed in the gill sample that was extracted from the oyster
Reflection:
Be careful with PCR Plate caps! They can easily spill all the contents
November 18, 2014 Lab 7
Summary:
This lab's purpose was to extract oyster samples and get RNA samples.
Materials and Methods:
1. C. Gigas (N=40) were randomly placed in 5 treatment groups (n=8).
Treatment group 1: Control -- no thermal or mechanical stress. Placed in cool environment until sample extraction.
Treatment group 2: Heat -- oysters were placed in a hot bath (30C) for 2 hours, 24 hours before sample extraction.
Treatment group 3: Mechanical -- oysters were spun in a bowl at 100 rev/minute, 24 hours before sample extraction..
Treatment group 4: Heat stress followed by mechanical stress. 24 hours before sample extraction.
Treatment group 5: Mechanical stress followed by heat stress. 24 hours before sample extraction.
All of these treatments were performed 24 hours prior to the lab.
2. Oyster samples were placed in test tubes with 500 uL of TriReagent.
3. Samples were homogenized with a pestle and additional 500 uL of TriReagent was added. All test tubes were thoroughly mixed.
4. 200 uL of chloroform was added to all test tubes and thoroughly mixed.
5. All test tubes were spun in a refrigerated Centri microfuge for 15 minutes at maximum speed.
6. Top layer was extracted to a new test tube and added 500 uL of isopropyl, spun at maximum speed for another 8 minutes
7. Pellet on the bottom of the test tube was isolated and 100 uL of nano pure water was added.
Results/Conclusion/Reflection:
Due to the fact that centrifuging of all 40 samples took a lot of time, we stored RNA samples to continue our lab next week.
November 4, 2014 Lab 6
Summary:
This lab's purpose was to create a working stock for a primer, dilute it and run qPCR to test if primer works.
Materials and Methods:
1. For each primer (forward and reverse) add nuclease free water to create 1:10 concentration (Ex. for 37.3 nMoles of primer add 373 uL of water). This will be the working stock.
2. Dilute cDNA of Crassostrea Gigas obtained in the previous lab by adding water, creating 5 concentrations (1, 1:10. 1:100, 1:1000, 1:10,000)
3. In a separate tube create a master mix for PCR. Add 12.5 ul of SSoFast Mix, 0.5 uL of forward primer, 0.5 uL of reverse primer, and 10.5 uL of nuclease free water. I needed master mix for 7 reactions and I wanted to have a little extra to be safe, so I multiplied all measurements by 8. Creating a total of 192 uL of master mix.
4. Label PCR tubes in order of concentration, add 1uL of cDNA in appropriate tubes and 24uL of master mix in each tube.
5. Transfer these samples onto a PCR plate and labels on a separate sheet. Run the qPCR.
Results:
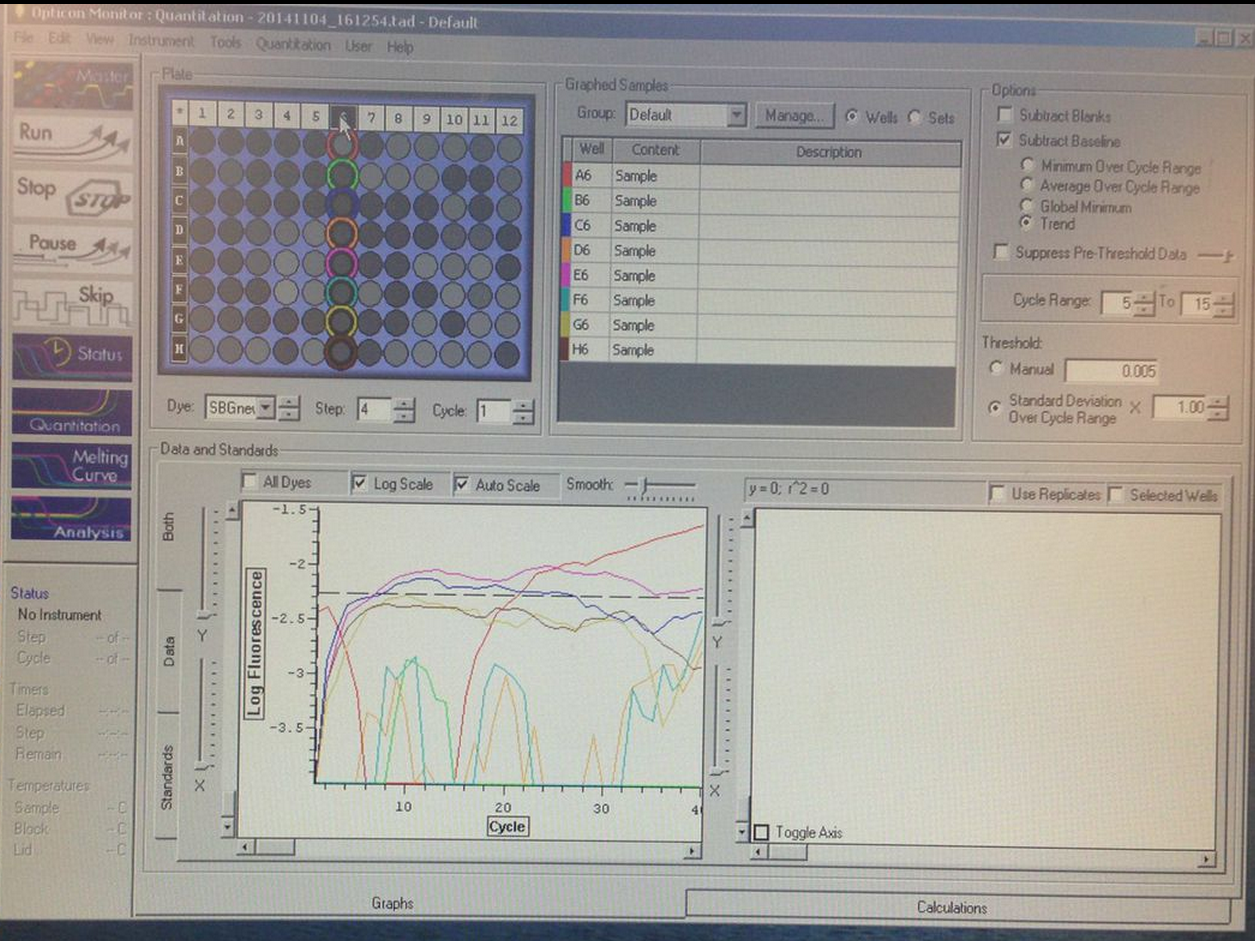
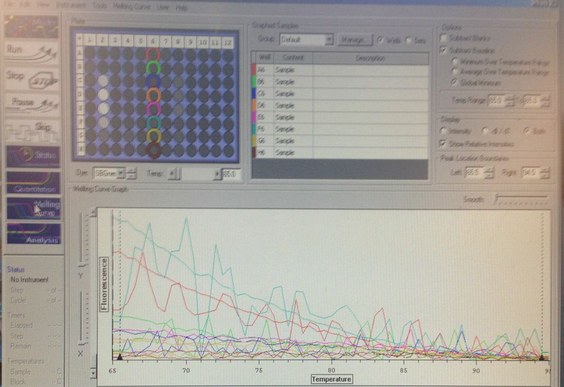
Figure on the left shows amplification of a well with fully concentrated cDNA, as well as the 1:100 and 1:10,000; not enough amplification for other four wells to pass the threshold. Melting curve shows highest fluorescence for a well with the most diluted cDNA and well that has fully concentrated cDNA. Overall results are unclear and inconsistent. I predict this could be due to the difficulties I had in this lab with pipettes.
Conclusion:
I expected these results because like I mentioned before, I definitely had measurement errors in this experiment. Overall it seems like the primers work. Amplification results are a bit odd, it is likely they are due to a measurement error or protein cDNA degradation.
Reflection:
It is important to calibrate pipettes prior to the experiment.
Research Proposal November 2, 2014
Background:
Human activities put lots of stress on aquatic organisms. To get a better understanding of the consequences, we will expose our model organisms to common stressors and measure their response.
Our model organisms are going to be Crassostrea Gigas (Pacific oyster) and Crassostrea Virginica (Eastern Oyster). Treatment groups will be heat stress and mechanical stress (microcentrifuge spin).
Research Objectives:
- To study the effects of heat and mechanical stress on C. gigas and C. virginica
- Study the effects on HIF 1a and HSP 70 genes in both C. gigas and C. virginica
Methods:
A sample size of 25 oysters (25 of C. gigas and 25 of C. virginica) can be divided into the following categories:
- 1. Heat stress
- a. 30C n=5
- b. 35C n=5
- 2. Mechanical Stress n=5
- 3. Mechanical Stress followed by 35C heat stress n=5
- 4. Control n=5
Mechanical Stress will be in a form of spinning in a microcentrifuge for 5 minutes. Just for comparison I thought it would be interesting to look at the effects of both mechanical and heat stress. Third treatment requires spinning oysters for 5 minutes followed by a heat stress at 30C for 3 hours.
Control group will be placed in 18-20C water with no mechanical stress.
After all treatments will be complete, extract samples and with appropriate primers run a PCR test to learn the effects of these treatment group on HIF1a and HSP70 genes.
Record any physical observations into a table like this. Also record PCR results for each treatment group.
# |
(1) Heat Stress 30C 35C |
(2) Mechanical Stress 5 minutes |
(3) Mechanical stress and 30C |
(4) Control |
|
| 1 |
|||||
| 2 |
|||||
| 3 |
|||||
| 4 |
|||||
| 5 |
|||||
| PCR Results: HIF 1a HSP 70 |
|||||
Timeline:
| Lab Days |
Procedures |
| Nov. 5 |
|
| Nov. 11 – Veteran’s Day |
|
| Nov. 18 |
|
| Nov. 25 |
|
| Dec. 2 |
|
Expected Results:
Mortality:
I expect no statistically significant differences between C. gigas and C. virginica. I predict high mortality for 35C treatment group, moderate mortality for 30C treatment group as well as the treatment group that will measure both mechanical stress and heat stress at 30C. I also expect low to no mortality for a treatment group undergoing just mechanical stress as well as the control group.
HIF 1a and HSP 70:
I expect high presence of HIF and HSP in heat stress treatment groups as well as the treatment group that has both mechanical and heat stress. I expect slightly lower presence of HIF and HSP in mechanical stress treatment group and very low to none in the control group.
October 29, 2014 Lab 5
Summary:
In this lab, our lab group brainstormed the upcoming research project. We decided to compare two types of oysters, Crassostrea Gigas (Pacific) and Crassostrea Virginica (Easter) and how they respond to heat stress. We also might look at how they respond to mechanical stress. The remaining lab time we spent learning how to search for primers.
Materials and Methods:
We used the NCBI primer tool to search for primers. First, find a gene of interest and then run the primer BLAST. This tool shows a number of different primers of various lengths.
Results, Conclusion and Reflection:
In reality, looking for primers turned out to be very time-consuming. After many hours of searching, I found one relevant primer for Crassostrea Gigas called Glutathione S-transferase. GST is known to detoxify xenobiotics so I thought it would be important to look at how increases in temperature will affect organism's abilities to protect from themselves from xenobiotics via GST.
October 21, 2014 Lab 4
Summary:
In this lab, a series of tests were done on a protein sample prepared in the previous lab. First, SDS Polyacrylamide Gel Electrophoresis was performed on the sample. It separated proteins based on molecular weight using electricity. Then we proceeded with Western Blotting protocol to probe separated proteins with protein-specific antibodies. We ran PCR on the cDNA from the previous lab to check if amplification was successful using electrophoresis.
Materials:
SDS/PAGE
- Protein Sample and Agarose gel prepared in Lab 3
- micropipettes with appropriate tips
- 1.5 mL screw cap tubes
- microcentrifuge tube rack
- heating block with water bath
- protein gel box
- SDS/PAGE gels
- trays for staining gels
- power supply
- platform rocker/shaker
- plastic wrap
- 2x SDS reducing sample buffer
- protein ladder maker
- gel running buffer
- light box
- floatie for tubes when boiling
Western Blot
- nanopure water
- gel staining tray
- blocking solution
- rotary shaker
- primary antibody solution
- antibody wash
- secondary antibody solution
- chromogenic substrate
- SDS/PAGE gel
- Tris-Glycine transfer buffer
- filter paper
Methods:
PCR/Electrophoresis:
1. Add 2.5 uL of dye to the cDNA sample from Lab 3
2. 20 uL of the total mixture (sample+dye) was placed into the agarose gel
3. Run gel for about 1 hour at 100 Volts and visualize the gel under UV light
SDS/PAGE:
1. In a screw cap tube, add 15 uL of protein stock (I used HB 21) + 15 uL of 2x Reducing Sample Buffer. Mix well using centrifuge.
2. Boil it for 5 minutes, load the sample into the well of the gel.
3. Power supply was at 150 Volts and we ran the procedure for 35 minutes.
4. Remove gel from the box, trim wells at the top of the gel and proceed with Western Blotting Protocol
Western Blot:
1. Briefly soak the filter paper, membrane and gel in Tris-Glycine Buffer
2. Assemble the following (Anode, filter paper, membrane, gel, filter paper, cathode).
3. Transfer the blot for 30 minutes at 20 Volts.
4. Remove gel from filter paper and rinse with transfer buffer.
5. Wash membranes twice with 20 mL of nanopure water for 5 minutes each
6. Incubate membrane covered in 20 mL of Blocking solution on a rotary shaker for one hour
7. Rinse membrane in 20 mL of water for 5 minutes
8. Incubate membrane in 10 mL of Primary Antibody Solution, pour out solution.
9. Rinse membrane in 20 mL of Antibody wash for 5 minutes, pour out solution. (repeat step 3 times)
10. Incubate membrane in 10 mL of Secondary Antibody Solution for 30 minutes, pour out solution.
11. Wash membrane for 5 minutes with 20 mL of Antibody wash, pour out solution. (repeat step 3 times)
12. Rinse membrane with 20 mL of pure water for 2 minutes, pour out solution. (repeat step 2 times)
13. Incubate membrane in 5 mL of Chromogenic Substrate until purple bands appear.
Deviations:
In SDS/PAGE step 3, procedure ran for 35 minutes instead of 45 like suggested in the protocol.
In Western Blot step 1, we briefly soaked filter paper and membranes instead of soaking it for 15 minutes like suggested in the protocol
Results:
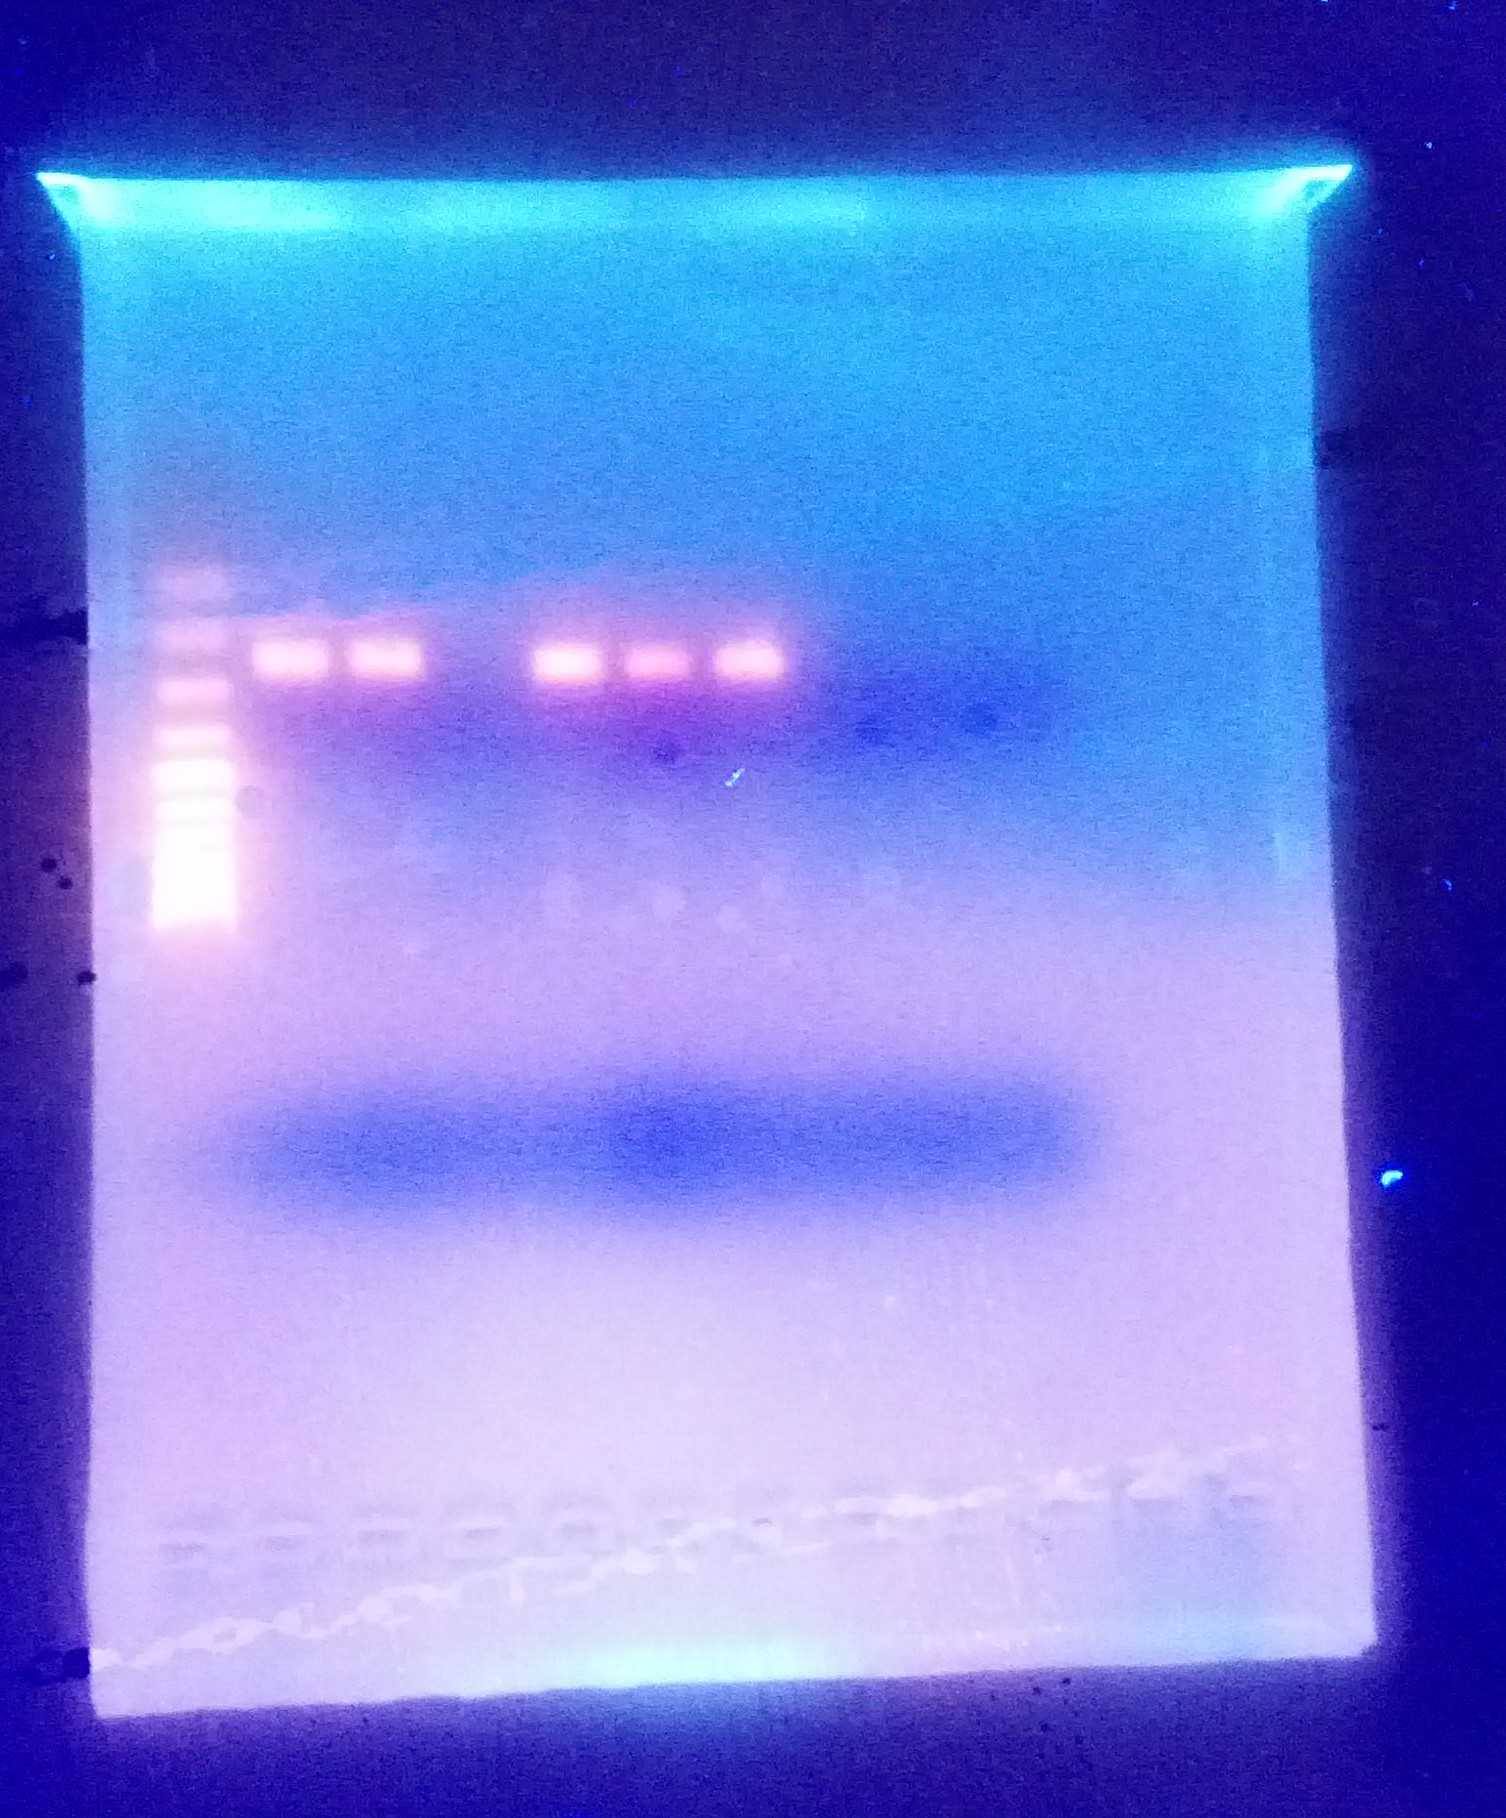
There was no PCR amplification for my well #3
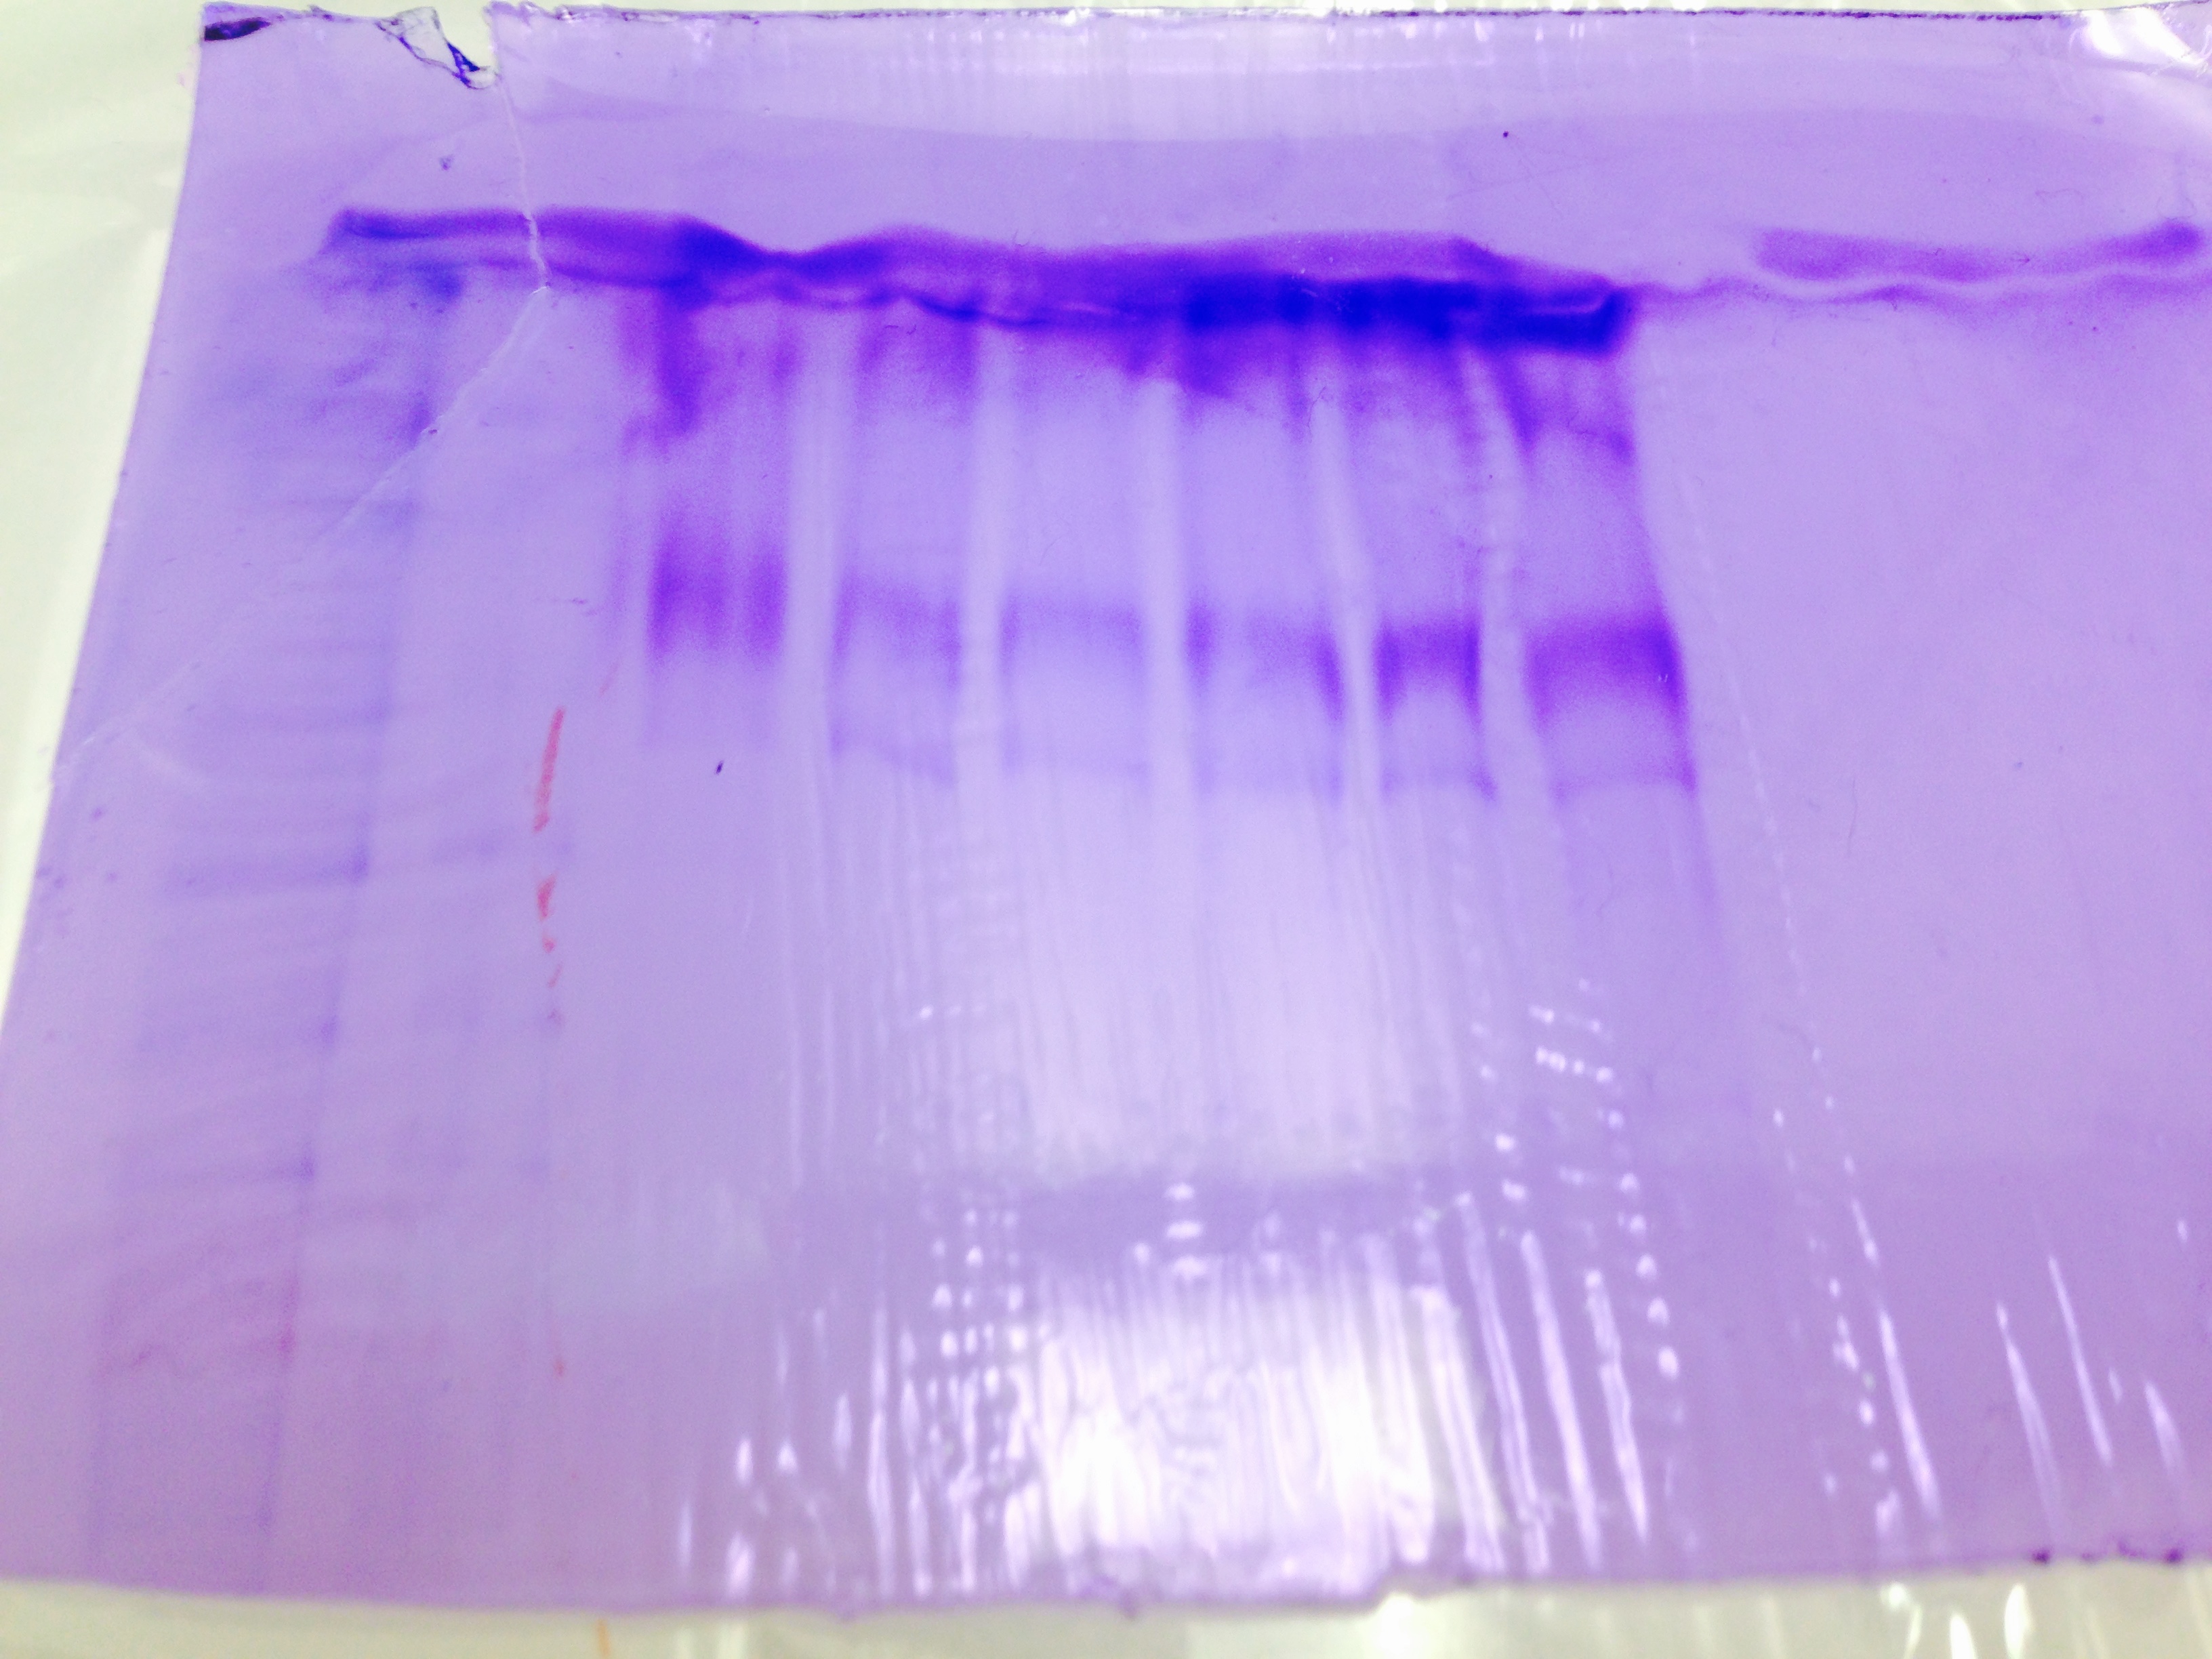
SDS/PAGE shows HSP 70 protein separation. However, there was a confusion about the way the gel was aligned so it is hard to tell what it was separated from.
Conclusion:
I was not surprised to get no data for the PCR electrophoresis because in the previous lab I did not observe any amplification with this sample. I suspect this could be due to sample degradation.
SDS/PAGE and Western Blot test show no clear results. There seems to be protein expressions, but it is unclear which proteins are expressed.
Western Blot expression normally takes 1-60 minutes. Shorter time indicates quicker binding, in our experiment it took longer suggesting there were fewer proteins for antibodies to bind to.
Reflection:
The time constraints of this lab clearly took a toll on the results. We cut 5-10 minutes here and there and I think it shows on how sloppy the results came out. We got to know how to perform these procedures but for next time, I think it would be better to follow the protocol to get accurate results.
October 14, 2014 Lab 3
Summary:
This labs primary objective was to reverse transcribe RNA to cDNA and run cDNA through qPCR. We also prepared a tissue sample for next lab.
Materials:
- RNA samples prepared in previous lab
- micro pipettes with appropriate tips
- 0.5 mL PCR tubes
- thermal cycler
- centrifuge
- Master Mix 1:
- 0.5 μL of oligo dT
- 12.5 μL of nuclease free water
- Master Mix 2:
- 1.5 μL of M-MLV 5x Reaction Buffer
- 1.25 μL of dNTPs
- 0.5 μL of M-MLV RT
- 0.5 μL of nuclease free water
- For PCR
- PCR Plates, optically clear caps
- 1.5 mL microfug tubes
- Nuclease free water
- Opticon thermal cycler
- Kim wipes
- 2x Immomix Master Mix
- SYTO-13 Dye
- micro fuge tube racks
- ice buckets
- timers
- For Agarose Gel
- 1L flask
- agarose
- 1x TAE
- Ethidium bromide
- Microwave
- Gel rigs
- Kim wipes
Procedures:
Reverse Transcription:
1. Prepare Master Mix #1
2. In a 0.5 mL PCR tube add 5 μL of RNA sample prepared in previous lab and 12.75 μL of Master Mix #1
3. Incubate mixture for 5 minutes at 75C
4. Add 7.25 μL of Master Mix #2
5. Incubate for 60 minutes at 42C and then heat inactivate at 70C for 3 minutes on a thermalcycler
6. Spin the sample in a desk tip centrifuge
7. Store on ice or at -20C
Quantitative PCR:
1. Prepare PCR master mix
2. Add master mix to white PCR plate
3. Add 1 μL of cDNA
4. Also add 1 μL of ultra pure water to create a control
5. Make sure to securely cap the wells
6. Run the PCR
Making an agarose gel:
1. Mix 2 g of agarose with 150 mL 1x TAE in 1L Flask. Microwave solution for 3 minutes (Do not boil over, the goal is to have no precipitate and no bubbles)
2. Let the solution cool down and add 12 μL of ethidium bromide.
3. Mix thoroughly. Pour into gel tray. Add gel combs, wrap in plastic and store in the fridge.
Protein Extraction and Analysis Part 1:
1. Weigh a selected protein sample and add 500 uL of CellLytic MT solution
2. Homogenize the tissue with a sterile disposable pestle
3. Spin the tube in a refrigerated micro fuge for 10 minutes at max speed
4. Transfer the supernatant to a new labeled tube an store tube on ice.
Results:
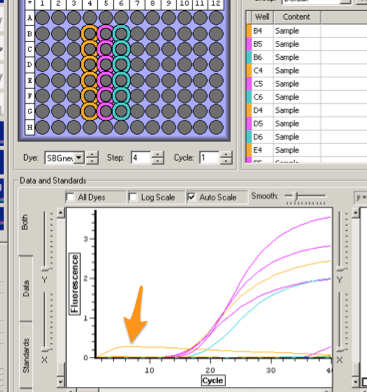
My sample was in C4 well and it is clear that there was no amplification in my sample
Conclusion:
I did not expect my sample to get no amplification. I used same master mixes as the rest of the class so it couldn't have been the problem (since their samples got amplification). It is unlikely but possible my sample was contaminated with foreign materials. It is also possible my RNA sample got degraded over the past week it has been stored in the lab and this also could have been a measurement error.
Reflection:
The purpose of this lab was to learn how to make cDNA from RNA and visualize results on PCR. This procedure is widely used in medicine; one of the ways it is utilized is to study various viruses that use reverse transcription. I am still unclear as to why my sample did not have any amplification -- this is something I wish I knew more information on.
October 7, 2014 Lab 2
Summary:
In Lab 2 I continued to work with the oyster sample prepared in Lab 1. I added chloroform to separate soluble cellular components -- RNA which was a distinct top layer of the solution that was later washed to get accurate results when RNA was quantitated using a spectrophotometer.
Materials:
- micro pipettes with appropriate tips
- refrigerated microcentrifuge
- test tubes
- chloroform
- isopropanol
- 75% ethanol
- Nano Pure Water
- Ice bucket
- vortex
- Nanodrop spectrophotometer
Procedures:
1. Add 200 μL of chloroform to the test tube prepared in Lab 1
2. Mix the contents for about 1 minute until it becomes an opaque uniform mixture
3. Spin test tube in a refrigerated microfuge for 15 minutes at maximum speed
4. Extract the top layer to a new test tube and add 500 μL of isopropyl
5. Spin test tube in refrigerated microfuge for 8 minutes at maximum speed.
Note: Place your test tube with the tube hinge pointing away from the center
6. Extract all the liquid from test tube, leaving only supernatant on the bottom
7. Add 1 mL of 75% ethanol to pellet and mix the contents
8. Spin test tube in refrigerated microfuge for 5 minutes at 7500 g
9. Remove as much liquids from the test tube as possible without removing any pellet
10. Leave tube open to allow pellet to dry at room temperature for <5 minutes
11. Add 100 μL of Nano Pure water and mix the contents
12. Incubate for <5 minutes at 55°C to help solubilize RNA
13. Place your sample on ice
14. Place 2 μL of Nano Pure water onto the Nanodrop, lower the arm and "zero" the device
15. Place 2 μL of RNA sample onto the Nanodrop pedestal and lower the arm
16. Click measure and record results
Notes and Deviations:
- The lab protocol recommended to use 0.1% DEPC treated water however, instead I used Nano pure water
- In Step 5, place your test tube with the tube hinge pointing away from the center, this will help isolate the supernatant
Results:
- A 260/280: 2.04
- A 260/230: 1.29
- Abs: 20.11
- 10.390 ng/μL
Conclusion:
The results above show ratios that represent purity of my sample. Ratio A260/A280 represents the amount of proteins present in your sample; desired ratio is between 1.8-2.0. Ratio A260/A230 represents the amount of phenol, ethanol, and/or salts in the sample; desired ratio is between 1.5-2.0. I am not surprised by these results, in fact, I was expecting A260/A230 ratio to be out of range because I had difficulties getting all the ethanol out of the test tube before washing RNA.
Reflection:
The purpose of this lab was to get familiar with a popular technique of RNA quanitfication using the Nanodrop. This is a widely used technique used in fields of genetics, forensics and medicine. Overall the lab was transparent and I have not encountered any confusion with any of the procedures necessary to complete this lab.
September 30, 2014 Lab 1
Materials:
- micropipette of appropriate capacity (500 μL)
- balance/scale
- scissors and tweezers to cut sample
- test tube See Fig. 1
- pestle
- TriReagent 1000 μL
- oyster tissue (gill tissue)
Procedures:
1. Obtain a sample of oyster tissue (I used gill tissue) ~50-100 mg
2. Add 500 μL of TriReagent
3. Homogenize the mixture with a manual pestle
4. Add additional 500 μL of TriReagent and thoroughly mix together
5. Store the mixture for future lab work
Data:
1.113 g empty test tube
1.196 g test tube + sample
0.083 g oyster gill sample
Summary/Conclusion/Reflection:
After getting familiar with lab safety, lab equipment (pipettes) and a bit of oyster's anatomy, I obtained 83 mg of oyster gill tissue thoroughly mixed together with a total of 1000 μL of TriReagent. This mixture has been stored in a test tube for future lab work.